Know when your website breaks or slows down.

Test your website now. Then let Nexio Watch monitor uptime, performance, SSL and visual changes 24/7.

  • Know immediately when your website goes down or slows down
  • Catch broken forms and critical workflows
  • Catch problems before your customers report them

No signup required

Your Website Can Be Up and Still Lose Customers

Website online
OK
SSL valid
OK
Contact form delivering
Broken
Customer workflow working
Broken
Lead reaching CRM
Broken
Scheduled job completed
Broken

Traditional uptime monitoring can show green while an important business process is broken.

Nexio Watch monitors what happens beyond uptime.

Monitor More Than Uptime

Business

AI flow monitors for your critical journeys

Keep the journeys that make you money working—contact form, checkout, login, booking, WordPress, Shopify, and WooCommerce. Pick a ready-made flow, and AI builds the browser steps for you.

  • No scripting—describe it once and we run it on a schedule
  • Multi-step checks that catch breaks a status code misses
  • Get alerted the moment a flow stops working
BetaBusiness

HubSpot lead monitoring

Your site can look fine while HubSpot goes quiet—no new contacts from a broken form path, or leads sitting uncontacted past your SLA. Connect one portal and get alerted before revenue walks away.

  • Alert when lead intake stalls (no new contacts in your window)
  • Alert when lead-stage contacts sit uncontacted past your SLA
  • One HubSpot portal per organization—Business plan
Pro & Business

Heartbeat monitoring for cron jobs

HTTP uptime checks won’t catch a job that never ran. Have your cron or worker ping a unique URL after each successful run—and get alerted when the pings stop.

Pro & Business

Visual break detection for client sites

Catch broken layouts, missing buttons, and unexpected content changes by comparing fresh screenshots to the last known good version—ideal for homepages, checkout flows, and marketing pages.
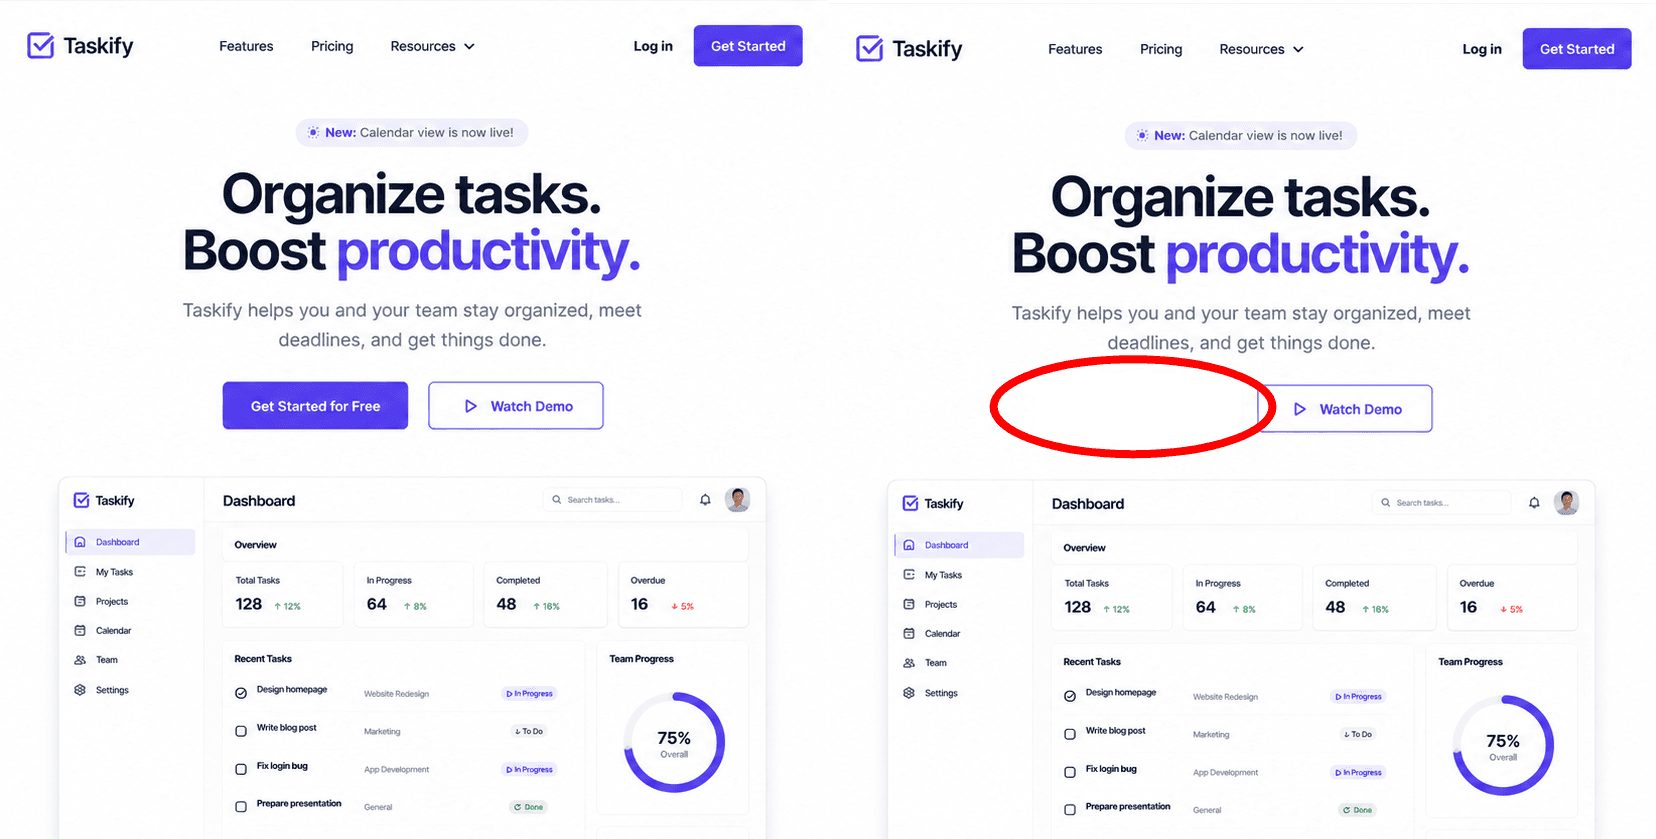
Side-by-side screenshot comparison showing visual changes detected between two versions of a page
Business

Wall-ready status board

Put uptime where everyone can see it: a shareable full-screen grid with one large tile per monitor, color-coded by uptime over a window you choose (10 minutes to 24 hours)—green, yellow, red, or blue when there is no data. Ideal for office TVs and ops walls; a short access code keeps it private.

API

Web

Auth

CDN

How it works

From deploy to peace of mind—without your customers ever noticing.

  1. You ship a deployment
  2. Nexio Watch checks your website
  3. A problem is detected
  4. Your team is alerted on Slack or email
  5. You assign, update status, and fix it
  6. Customers never notice

See it the way your team will

Real alerts that protect revenue, leads, and customer trust.

  • Contact form monitor
    acme.co/contact
    Website
    Online
    Response time
    220 ms
    Contact form
    Failed
    Started
    12 minutes ago

    Slack notification sent

  • Checkout monitor
    shop.acme.co/checkout
    Website
    Online
    Successful purchases
    None for 2 hours
    Status
    Alert triggered

    Team alerted before revenue was lost

Built for teams that can’t afford silent failures

  • Agencies
    Monitor all client websites from one dashboard.
  • SaaS
    Detect production issues right after deployments.
  • Ecommerce
    Protect checkout revenue around the clock.
  • Local businesses
    Never lose an enquiry to a broken form.
  • Marketing agencies
    Ensure landing pages always work.

Why Nexio Watch

Everything a traditional uptime monitor does—plus the failures it misses.

FeatureTraditional uptime monitorNexio Watch
Website downtime
SSL expiry
Broken forms
Checkout monitoring
Visual regression
Scheduled jobs
Incident timeline, assign & status
HubSpot lead intake & SLA (beta)
Revenue monitoring (coming soon)

Teams already rely on it in production

Live numbers from our EU checkers—updated every few minutes.

  • 14.5K

    Checks per day
    HTTP, SSL, DNS, and visual checks across EU regions (last 24h)
  • ~8s

    Median alert delay
    From failed check to your first notification
Pro & Business

Incident handling built for client handovers

When a monitor goes down, open an incident with a full event timeline. Assign an owner, acknowledge, and post Investigating / Identified / Monitoring updates—optionally to the same Slack, email, or webhook channels you already use.

  • Auto-created from outages, or open a manual incident
  • Assign teammates and acknowledge separately from alerts
  • Status messages land in your alert channels

Straightforward pricing

10 monitors free—no card. Upgrade for 1-minute checks, Slack, SMS, incident handling, and the wallboard.

Set up in ~60 seconds · No credit card

  • Free

    $0

    • 10 monitors
    • 10 min interval
    • 7 days history retention
    • Monitor types
      • Website outage alerts
      • Speed monitoring
      • Certificate expiry
      • Domain expiry
      • DNS resolution
    • Integrations
      • Email
  • Pro
    Most popular

    9€/mo

    Everything in Free, plus:

    • 20 monitors
    • 1-minute checks · 10× faster than Free
    • 30 days history retention
    • Monitor types
      • Scheduled job (heartbeat) monitoring
      • Form & conversion checks
      • Visual break detection
      • Multi-check health analysis
      • Website performance
    • Integrations
      • Slack
      • Outbound webhooks
      • REST API
    • Teams
    • Incident management (timeline, assign, status updates)
    Upgrade

    Cancel anytime · Billed via Stripe

  • Business

    29€/mo

    Everything in Pro, plus:

    • 100 monitors
    • 90 days history retention
    • Monitor types
      • AI flow monitors
      • Unreplied Gmail monitoring
      • HubSpot lead monitoring (beta)
    • Integrations
      • Discord
      • Telegram
      • SMS
    • Shareable status board
    Upgrade

    Cancel anytime · Billed via Stripe

Catch the next outage before your client does

Paste one URL. No credit card. Ten monitors free—upgrade when you need faster checks or Slack.

Quick answers

  • How many websites can I monitor?
    The Free plan includes 10 monitors, Pro raises that to 20, and Business to 100. Each monitor watches one URL or check, so you can mix uptime, SSL, forms, and more across your sites.
  • Can I monitor forms?
    Yes. We run a real test submission on a schedule and verify the success message still appears—so you catch a broken contact form before you lose leads, not just that the page loads.
  • Can I monitor HubSpot leads?
    Yes—on Business (beta). Connect one HubSpot portal and get alerted when new contacts stop arriving within your intake window, or when lead-stage contacts sit uncontacted past your SLA.
  • How does visual monitoring work?
    We capture a screenshot baseline of your page, then compare fresh screenshots over time. When the layout changes unexpectedly after a deploy, you get an alert with a visual diff—ideal for homepages and marketing pages (Pro & Business).
  • Can I monitor APIs?
    Yes. Point a monitor at any endpoint to check status codes, response time, and that the response contains the text you expect—great for health checks and backends.
  • Can I monitor scheduled jobs?
    Yes. Your cron job or worker pings a unique heartbeat URL when it finishes; if the pings stop, we alert you to missed runs and silent failures (paid plans).
  • Where is my data stored?
    We operate from Finland with operational data kept in the European Union—EU-hosted and GDPR-friendly.
  • Can I cancel anytime?
    Yes. Paid plans are billed through Stripe, and you can change or cancel anytime from your account—no lock-in.